Schedule management applications use percent complete fields as a convenient shortcut for recognizing progress. However, managers can rely too heavily on this metric and its perceived significance.
The concept of percent complete is open to conflicting interpretations. Because the field can be treated both as a user input, and a calculated output, it is possible to record progress in inconsistent ways. Unwitting and even nefarious project managers can use percent complete to obscure lack of meaningful progress. But most critically, percent complete does not directly answer more fundamental Schedule Management questions. How much work is left? When will the effort finish?
This article will discuss the technical and human reasons why percent complete has limited value, and some more rigorous measures for determining project progress.
Arbitrary Interpretations of Percent Complete
When is a task 10% complete? When is it 27% complete? A Testing and Quality Assurance team may argue a regression testing effort’s progress is tied to the number of successfully passed test cases, or to the number of test cases completed, pass or fail. A document reviewer may calculate percent complete based on the number of documents reviewed or the number of pages reviewed. A developer may consider their work done when the code functionality written, with no thought for peer reviews or documentation. One project manager may associate percent complete with the total number of tasks regardless of size, while another bases percent complete on the total number of hours worked.
When a project is progressing well, these separate interpretations are of little consequence. However, when an obstruction threatens to impact a major milestone or delivery, misinformation between teams can lead to misunderstandings of a task’s risk or criticality. Miscommunication always exacerbates a project’s technical and logistical jeopardies.
Schedule Management tools such as Microsoft Project attempt to solve this issue with several options for recording percent complete as a measure of progress. But the remedy also creates new problems.
Idiosyncrasies in Schedule Management Tool Percent Complete Fields
Recognizing that percent complete is subject to individual interpretation, Microsoft Project offers three percent complete fields. Percent Complete and Percent Work Complete1Detailed explanations of Microsoft Project’s Percent Complete and Percent Work Complete can be found here: https://support.office.com/en-us/article/Percent-Complete-fields-84ec5068-4a34-497c-97eb-e12b6dc47cc5 convey similar concepts but use different methods to compute their values. Physical Percent Complete2A detailed explanation of Microsoft Project’s Physical Percent Complete can be found here: https://support.office.com/en-us/article/Physical-Percent-Complete-task-field-4866cb37-f404-42e2-9241-6b144330c806 is independent of calculated task progress and can be used for determining earned value.
Microsoft Project introduced the Percent Complete and Percent Work Complete fields as a convenient way to record and track progress. When a Schedule Manager increases Percent Complete, or Percent Work Complete on a schedule that includes effort estimates, Microsoft Project uses the basic algebra of Figure 1 to calculate the Actual Duration and Actual Work consumed by the new progress recorded. Similarly, if Actual Duration or Actual Work are incremented, the corresponding percent complete estimates will adjust as well.
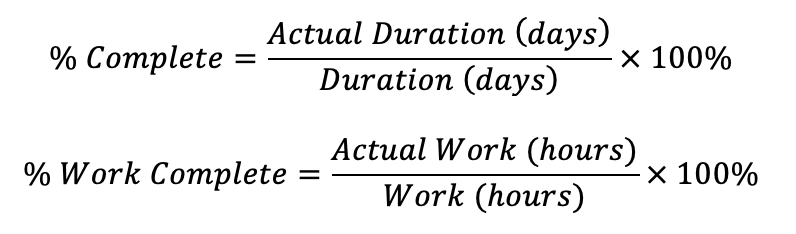
Note that neither percent complete calculation references Baseline Duration nor Baseline Work. Percent Complete is often misinterpreted to measure progress against the baseline even though the metric was never intended for this function.
Since both percent complete fields affect two other variables, adjusting one variable will impact at least another. This may cause unintended consequences. For example, suppose a two-day sixteen-hour task is recorded as being 50% complete. Microsoft Project interprets this metric to mean that one of the two days has passed, and eight hours of work have been accomplished.

Now suppose the developer is unexpectedly sick for three days. Increasing the Task Duration stretches the Finish date, but lowers the Percent Complete from 50% to 20%.

The Task hasn’t become any harder, there was simply a delay. Reporting a drop in Percent Complete would mislead stakeholders that the work went backwards, so the project manager restores Percent Complete to 50%. But this change unintentionally and incorrectly changes the Actual and Remaining Work estimates.

This predicament has two workarounds. However, they present difficulties of their own. The first workaround is to ignore Percent Complete in favor of Percent Work Complete. In the example above, Percent Work Complete is not impacted by the schedule delay. However, if a Task requires more effort than previously estimated, increasing the Remaining Work will reduce Percent Work Complete, which again risks misrepresentation. Furthermore, Project Managers loath reporting a progress decrease that might imply they have poor control of their project and their team.
The slightly better solution is split the task. Splitting a task acknowledges a break in work without impacting the Duration or Percent Complete fields. But making such changes by hand increases the number of variables that a Schedule Manager must juggle. Increasing the complexity of the Schedule Management process increases the tedium and the opportunity for mistakes, all for the sake of attaching too much meaning to Percent Complete.
Meaningful Progress Metrics
When work is stagnating, team members may attempt to feign progress via negligible increases in percent complete. Beware of false prophets.
A project team held daily project schedule meetings with over forty developers, managers, and clients on the call. One day, a developer reported that the status of a single eight-hour DevOps task improved from 97% to 98%. The next day the Task improved to 99%. The literal implications are extraordinary! 1% of an eight-hour task equates to just under five minutes of work. Did the developer work five minutes on the task yesterday, and another five minutes today? Why is the developer so busy that they can only devote a cigarette break to finishing this task? If the developer leaves the call, can they complete the Task before the end of the meeting? Alas these and more important questions were never raised. The project manager running the call dutifully recorded the progress, failing to recognize that this task had been stalled for three days and would soon impact the next delivery milestone.
While the above example comically illustrates a worst-case scenario, it is not hypothetical. Percent Complete changes as high as 15% against any size task can still mask the reality that no meaningful progress has been achieved. Recording insubstantial percent complete estimates makes blind, unverifiable claims of progress.
For reporting, percent complete holds questionable value. Executive stakeholders typically ask for overall schedule progress, and whether key milestones will be met. Schedule progress at the executive level is almost always reported in terms of the Schedule Performance Index (SPI). Impacts to key milestones are reported as projected finish dates or finish variances (delays) estimated in days or weeks. Is the manager who tells leadership that their project is 68% complete really telling them anything valuable? What decision can be affected by that information?
Mitigating Percent Complete’s Impact
Only the PMO offices and programs with high maturity business practices can ignore percent complete entirely. This requires tracking of actual work against each task’s estimated effort and regular meetings with team leads to discuss resource loading, remaining duration, and remaining work. Despite its risks, percent complete’s convenience is sometimes the only practical method for recognizing progress against a large schedule.
To ensure that percent complete’s convenience is not offset its risks, the following mitigation steps can be taken within any project schedule.
- Adhere to the 4/40 or 8/80 rule.3The 4/40 rule of thumb (and similarly the 8/80 rule) states that almost all tasks should require no less than 4 hours and no more than 40 hours of effort to complete. This helps prevent any single task with an inaccurate status from misrepresenting large portions of the overall project.
- Track progress in terms of effort rather than in terms of duration. Effort is a more intuitive metric, especially since team members rarely focus one hundred percent of their concentration on a single task at a time. Even without resource loading, a task’s effort, and percent work complete can be tracked separately from task duration.
- The only assurance that a task is completely done is when it has an actual finish date recorded. A task that is marked complete has nothing left to do and will never be revisited.
- Require partial progress updates in twenty-five percent increments. This simplifies both reporting responsibilities and accountability. For projects schedules built with ample detail, these increments should provide sufficient accuracy. Remember, that the key metric is the finish date.
- Avoid reporting percent complete to stakeholders, even when they ask for it. SPI, schedule variance and other metrics convey a more accurate picture and provide higher quality decision making information.
Related Case Study: John’s Progress