The long week is finally over. You added two new subprojects to the schedule baseline, reviewed the schedule with half a dozen managers, sent monthly metrics to the Finance and Earned Value Team, and published the weekly “Schedule SITREP” report that gets shared with new hires and client leadership alike. Along the way, you caught a looming deadline that would have postponed the next release, helped one manager smooth her employees’ 60-hour/week workloads, and warned another manager that his team would have nothing to do after the winter holiday – unless they finally get Procurement to purchase that custom hardware.
Your Schedule Management Office deserves real credit for keeping things running behind the scenes. But a problem is surfacing which, if left unchecked, could derail everything. The responsible team might have a chance to diffuse the situation. But no one knows where the trouble is brewing, not even you.
So continues the Schedule Manager’s endless waltz. What if every week is this frenetic? How can the Schedule Manager keep pace on a large ever-changing project without burning out? The difference between an insurmountable workload and routine chores is not the size of the task list, or the wellbeing of the project. It’s the preparedness of the Schedule Manager. A well-equipped Schedule Manager will execute the worst week of the project with the same poise and stamina as their most boring week.
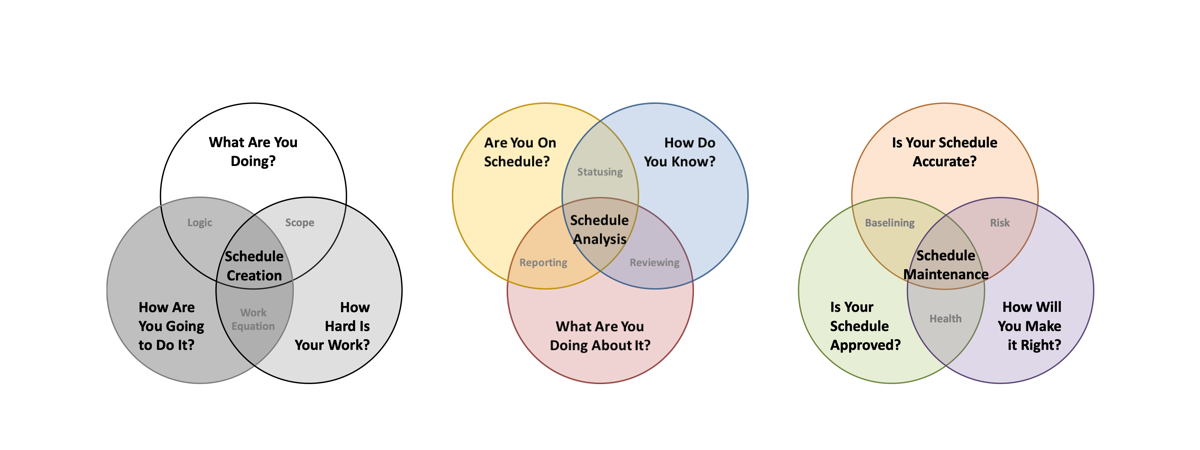
Schedule Analysis Principles explained why the process of statusing, reviewing and reporting a schedule must occur with comprehensive regularity to be useful. This article will discuss how to efficiently read and analyze schedule files to pinpoint which components of the schedule need attention.
Learning What Matters
Every substantial project has work which does not go according to plan. Much of the time, the delay or hastening of an activity has no significant impact on the overall schedule. Sometimes, a schedule variance will impact subsequent activities or create a resource bottleneck. This happens either when an affected task is on the critical path, or the resources (team members) must postpone seemingly unconnected work until their schedule clears.1For example, a shopping website’s search page and secure customer checkout page do not depend on each other to function, but the system architect won’t have time to design the search page until they have finished designing the checkout page.
Remedying schedule variances can be difficult, and sometimes time consuming. The art of schedule analysis starts with knowing which schedule variances should be fixed, and which delays aren’t worth the trouble.

When problems arise, Project Managers and team leads have several remedies at their disposal. But corrective action can’t be considered if they don’t realize the threat. Finding those threats and warning the team is the Schedule Manager’s responsibility, and the most valuable role they play on the project. Schedule Managers have two sources of knowledge for understanding which schedule variances matter. The first is the hard data contained within the schedule: task durations, dependency logic, and resource loading. The second source is institutional knowledge.
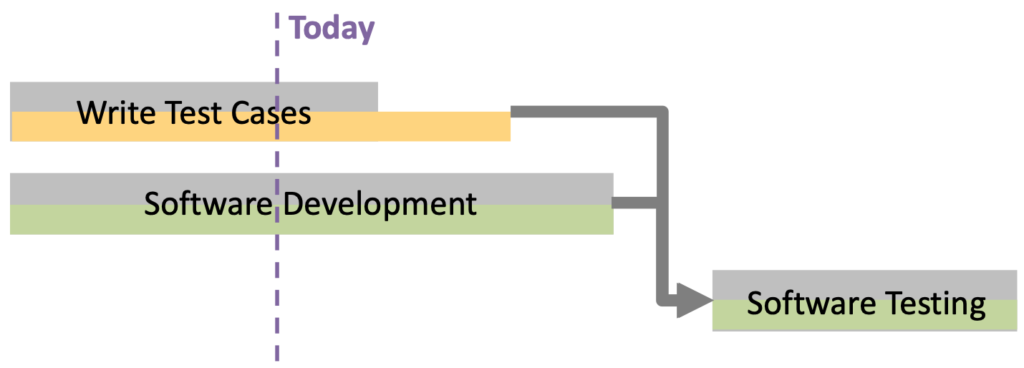
Schedule logic (when done properly) tells stakeholders what is on or close to the project’s critical paths.2Project schedules often have a critical path which runs the length of the project. Large projects may have one or more local critical paths which affect a release, or other significant event. Schedule Managers should perform the same critical path analysis on local critical paths that they perform on the larger critical path. Variances when compared to activities’ total remaining slack can guide the Schedule Manager’s decisions about where to spend time reviewing the schedule in depth. For example, consider Figure 8, where the Test Team is running two weeks behind writing all their test cases. It may be of future interest to understand what caused the Test Team’s work to slide. However, since Software Development is the task driving the start of Software Testing, rushing to finish writing the test cases is of little benefit to the project. In fact, diverting resources to rescue test case writing may delay Software Development by taking available resources.
Other knowledge about which delays matter are tied to understanding the client and the project itself. Some clients are amenable to postponing a major release to launch with all necessary functionalities. Some projects have unchangeable deadlines that connect to major events outside the project. Other projects may have valuable resources who are only available at a certain time. These institutional factors will help Schedule Managers and Project Managers make informed decisions about how to achieve the most successful (or least terrible) project outcomes given the circumstances.
So how does a Schedule Manager look at a several thousand-line project schedule and spot which few lines require decisive action? The answer is quickly.
Speed
Since projects are inherently fluid, any single schedule analysis will have a short shelf life for project teams. Over the course of a busy workweek, Schedule Managers have only hours to glean a comprehensive picture of where the schedule has shifted and how consequential variances can be corrected. The most important thing a Schedule Manager can do is find their quarry with haste. Fortunately, even the largest schedules can be analyzed rapidly, if the Schedule Manager knows where to look and what to look for.

Where to Look
Suppose you are asked to investigate a large project schedule that is running two months behind. Each line of a resource loaded schedule contains fourteen schedule data fields.3Start, Finish, Duration, Work, Resources, Dependencies (possibly with lag), Constraint Dates, Baseline Data and Actuals. In a 15,000-line schedule, that equates to 210,000 data points collectively determining the project’s end date. Somewhere buried in that mountain of information are a hundred tasks which may be driving the project’s current delay. And scattered across those hundred tasks are perhaps a dozen data points which are the real culprits.
Analyzing every line item would be daunting. But since comparatively few tasks can be postponing the project’s finish, large swaths of the schedule file can be ruled out of the analysis. In fact, without even tracing a critical path, the Schedule Manager can cut their initial analysis down to tasks which are currently being worked, overdue milestones, and tasks that have just completed.
Newly completed tasks can be analyzed rapidly. Their only relevant variables are the finish date and successor tasks (including lag). It is rare for completed work to be a schedule file’s source of trouble. Overdue milestones, if they are impacting the schedule, will almost always be on the critical path. Occasionally, a schedule file will have resource constraints which are impacted by a shifting milestone. But most schedule delays can be found in the tasks currently being worked. Even on a large heavily delayed schedule, only a fraction of the in-progress tasks are likely to contain information directly contributing to the delay.4Suppose a project schedule contains 15,000 lines and 250 team members. Even if each resource is been assigned four tasks on a given work week, the total number of tasks worked is no more than 1,000 tasks, or 0.07% of the schedule.
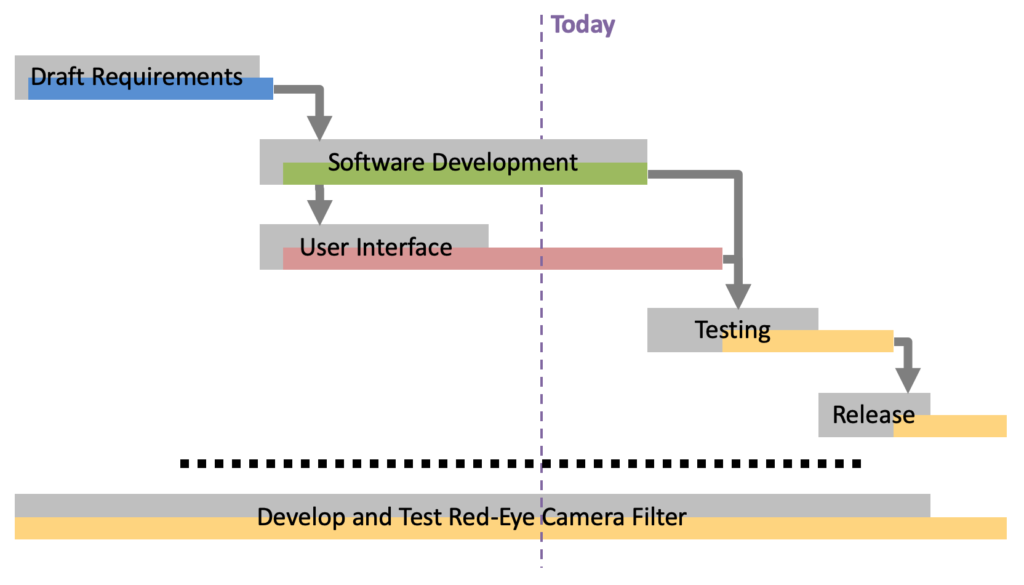
Here lies a key benefit to building a detailed project schedule. Lots of little tasks are easier to troubleshoot than one large task. Consider the work to build a red-eye reduction filter for photographs in Figure 9. If all five software development tasks were merged into a single large task, it is not obvious what component of the software development process has delayed the overall work, or whether a remedy even exists. The increased level of detail allows the Schedule Manager to focus their efforts on remedying the User Interface task, while also providing a warning to the Test Team that they may have to start testing late, or concentrate initial testing efforts on software functionality, instead of user interface testing.
What to Look For
As with baseball, scores of metrics can be calculated to measure schedule performance, but it is very easy to produce a useless analysis simply by looking at the wrong metrics. Which metrics will provide the most beneficial information to the project team? Remember that schedule analysis’s imperative is to provide Project Managers and team leads with decision quality information. This inherently forward-looking activity requires forward looking knowledge.
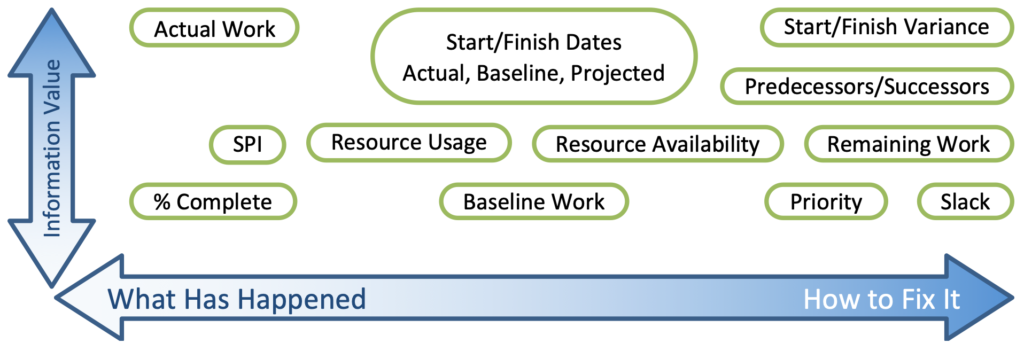
For example, consider Schedule Performance Index (SPI) which is shown in the middle-left of Figure 10. SPI is an appealing metric, especially in Earned Value Management. It distills an entire project down to a number which tells executives whether a project is running ahead or behind. Tracking at regular intervals tells leadership which direction projects or programs are trending. Though properly calculated in conjunction with Cost Performance Index (CPI) as a ratio of dollar estimates, SPI is robust enough to be reasonably estimated using billable hours or even task progress.
But what decision quality information does SPI offer project leadership? A low SPI score may indicate to a manager that their planning process is underestimating the work, or that the project does not have enough resources.5It is worth mentioning the axiom that adding new resources to a project in a short-term attempt to compress the schedule often backfires. However, a Project Manager may have other sustainable and unsustainable options at their disposal to remedy resource bottlenecks. But if more resources and better planning aren’t the answer, SPI only tells the project manager how quickly they’re drowning.
Consider instead, the much more targeted metric Finish Variance, which compares a task’s projected finish date to the baseline finish date. Both Finish Variance and SPI compare current progress (or lack thereof) to the original plan. However, Finish Variance is much more useful to managers in the trenches because it can tell them what activities and teams need the most attention.
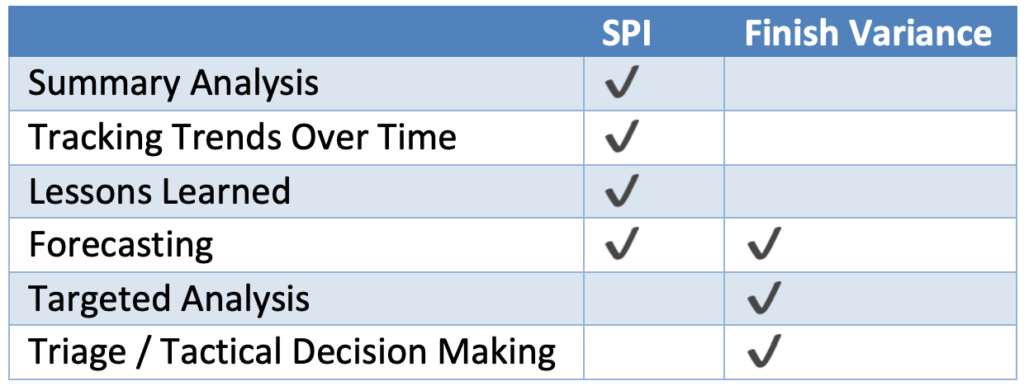
The contrast of schedule detail in Figure 9, partially mirrors the strategic and tactical value of SPI and Finish Variance. Both metrics have merit, however the quality and purpose of the information they provide varies significantly. Even though Figure 11 shows that both metrics can be used for forecasting, the type of forecasting that each metric offers differs.
While the utility of Finish Variance and SPI bridge most types of projects, it is difficult to generalize about all schedule metrics because the nature of projects varies so greatly. Some metrics will be more useful in certain situations than others. The key for the Schedule Manager is to know which metrics will provide their managers and project teams with the best decision quality information.

Next Steps
So far, we have overviewed the Schedule Manager’s role providing project teams with the decision quality information, the importance of picking the right metrics for each project, and the need to execute the schedule analysis cycle with sustained haste. Statusing Fundamentals will examine how to establish a sustainable statusing cycle to set the project’s heartbeat, and the essential data statusing should collect in preparation for schedule reviewing.