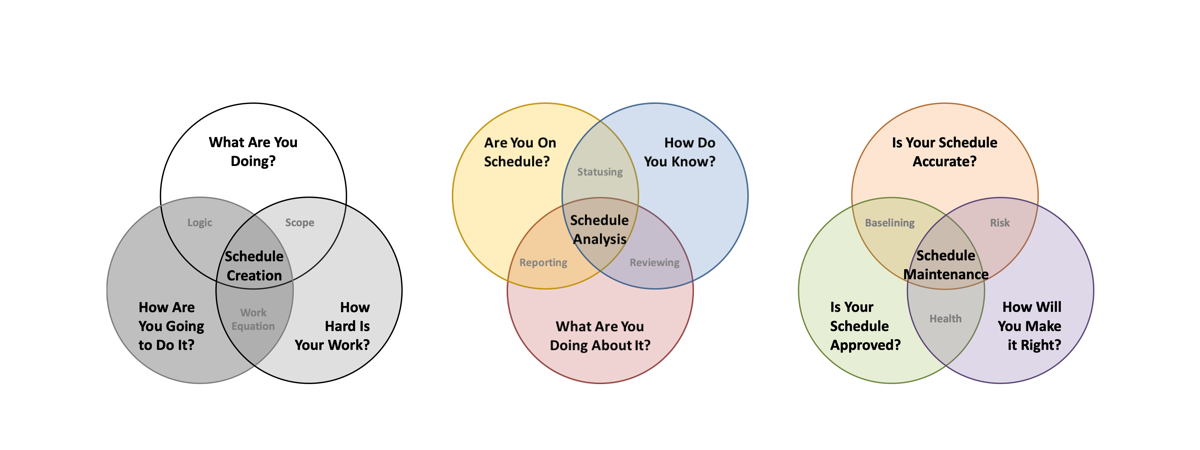
Besides schedule creation, and building schedule logic in particular, schedule statusing is the most crucial step in the Schedule Management process. And while the effort of building new schedules tends to ebb as a project ages, statusing requires the same intensity every cycle.
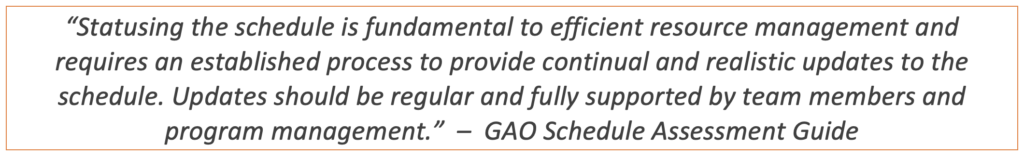
Statusing is as laborious as it is necessary. This article will discuss the most valuable progress data to collect so that project teams, especially team leads see real benefit to supporting the process.
Units of Measure in a Schedule
Suppose you are overseeing a single-family home renovation, and the contractors provide the following updates.
- Thirty percent of the back patio stone has been laid.
- Five of eight new windows have been installed.
- The kitchen remodeling has cost $26,500 of the estimated $50,000.
- 1,280 of 4,200 square feet have been repainted.
These updates pass the basic tests for verifiability discussed in Statusing Fundamentals. But they are problematic for a schedule file which measures progress in units of time. Schedule Managers may be tempted to make do by using percentages to correlate one unit of measure (square feet, pages written, cost, or quantity delivered), with time. Figure 16 depicts a very common Gantt chart view of duration and relative progress. The Schedule Manager has shoehorned the home renovation status updates into a measure of percent complete.
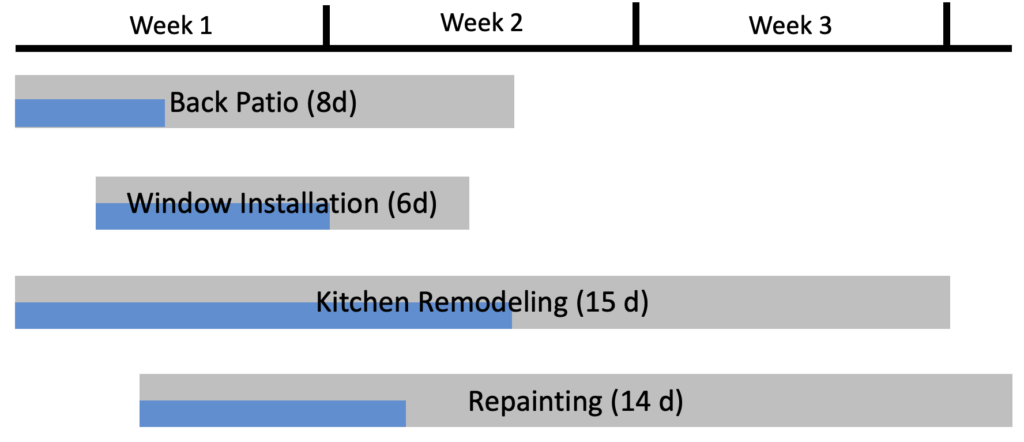
This correlation works so long as progress is approximately linear. For example, each of the eight windows should take roughly the same amount of time to install. So, it’s reasonable to correlate installing five of the eight windows with a duration progress estimate of 62% so long as the work goes as planned.
Tracking the kitchen remodeling progress is far more complicated. Custom built cabinets and countertops may have very nonlinear progress, even for a skilled carpenter. The sequencing of electrical, gas, and plumbing hookups affects duration, as does contractor availability, and appliance availability from the vendor. And expenses for kitchens are very nonlinear. Appliances require a down payment, and the contractor often gets paid in lump sums. Converting the $26,500 of expenses into an equivalent measure of schedule progress is meaningless. Earned value management could reveal whether the project is trending ahead or behind. But dollars, square feet, and unitless percentages can’t gauge the future. A cost variance could just as easily foretell rising material expenses as extra labor.

Project teams often status their schedule using percent complete estimates or some other unit besides time because the intuitive relation seems convenient. In the long run, leaning on percent complete almost always costs more time than it saves, especially when work runs late.
Duration Versus Effort
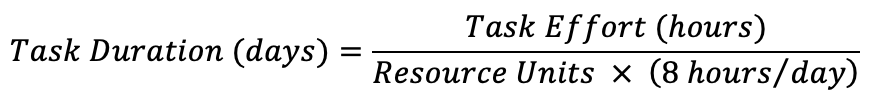
The simplest logic driven schedules measure task durations, with no consideration for how hard tasks are being worked. Fully built project schedules are resource loaded, with effort and duration estimates linked by the work equation.
If a schedule tracks both effort and duration, it is far preferable to status using effort. Duration does not always map to people’s perceptions of progress, especially when a task is being worked part time, or by several people.
If a schedule only tracks duration, it is still preferable to status the schedule using duration versus any other measurement, including percent complete. Team members like to think about progress in terms of percent complete. Percent complete is conceptually intuitive for nearly every measure of progress except, as luck would have it, duration. This is because task durations tend to lengthen. Figure 18 depicts work on the back stone patio encountering an unavoidable weather delay. As shown, the simplest way to adjust the task is to increase the remaining duration.1This task could be split to reflect the interruption. However, it is equally common for a duration to be extended because work is going slowly. Suppose that only one of stone mason is available instead of two.
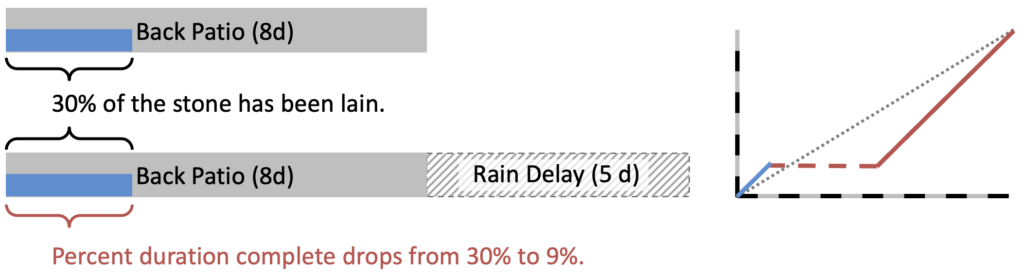
Consequently, percent duration complete shrinks, even though the project team hasn’t lost any ground. Novice managers and Schedule Managers lose countless hours recorrecting duration and percent complete estimates because work is running a day or a week late. Were the team tracking progress in terms of hours worked, extending the task’s duration wouldn’t appear to diminish progress made to date.
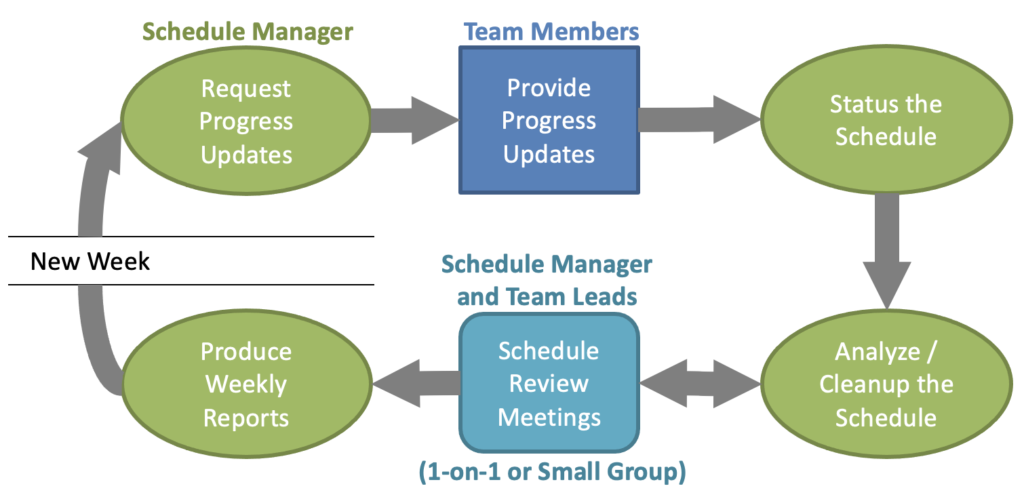
Setting the Project’s Heartbeat
Schedule Analysis Principles introduced the concept that frequent regular status updates improve status quality while reducing the burden of individual status updates. A thoughtfully implemented statusing cycle dramatically improves the project team’s quality of life by eliminating uncertainty about project progress and reducing projects’ disruptive unpredictable nature. Getting to that regular cycle can be difficult. Project teams resist the distraction of parasitic chores, even when the chore’s tax is comparatively miniscule, and especially when the benefits are hard to see.2Assuming generously that a team member spends 10 minutes a week assisting with statusing the schedule, that will cost approximately eight hours (0.04%) of their work year. But what is gained is almost indescribable to project teams that have never experienced consistency in project management before. One of Agile development’s main selling points is the consistency and predictability which sprint cycles bring to the management of difficult projects and work environments.3Ball, Andrew, Nair, Ajay, Hering, Mirco, “Key Accenture Learnings on Scaled and Distributed Agile Delivery”. (2015) https://www.scaledagileframework.com/accenture-case-study
A consistent process ensures that even a project’s worst week is executed with the same process stability as the project’s easiest (or most boring) week. Whether the project gets ahead or falls behind, every week that the project team can answer schedule analysis’s “Big Three” questions is a week that the project team has prevented the project from drifting into uncertainly.
The No Changes Fallacy
Some managers’ favorite status update is “no change to the schedule”. This brief proclamation is commonplace in meetings or group communications. Giving the manager benefit of the doubt, the update suggests that all is going as expected. But “no change” is an impossible claim.4It is easy to invent an edge case or reword the manager’s claim to make it selectively true. But splitting hairs doesn’t work for long. Deadlines encroach every reporting cycle. And every reporting cycle, project teams make enough progress to stay on target, or they fall behind. Statusing does not grant benefit of the doubt. After all, “no changes” could just as easily refer to the amount of progress made in the past week. It is very difficult to verify nothing has changed on a project document which is constantly changing.

Next Steps
This article has covered the importance of statusing the schedule regularly and why status updates measured in units of time are the most dependable unit of measure for updating a document dedicated to time management.
Schedule Statusing Techniques will discuss the importance of dedicating time to the statusing process, the best methods for collecting credible status updates, even with imperfect data, and how to guarantee compliance or else!